VSCode Extension
The SpecForge VSCode extension provides a comprehensive development environment for writing and analyzing Lilo specifications. It combines language support, interactive analysis tools, and visualization capabilities in a unified interface.
See the VSCode extension installation guide to get setup.
Overview
The extension provides:
- Language Support: Syntax highlighting, type-checking, and autocompletion via a Language Server Protocol (LSP) implementation
- Diagnostics: Real-time checking for type errors, unused definitions, and optimization suggestions
- Code Lenses: Interactive analysis tools embedded directly in your code
- Spec Status Pane: A dedicated sidebar for navigating specifications and saved analyses
- Spec Analysis Pane: Interactive GUI for spec monitoring, exemplification, falsification, etc.
- Notebook Integration: Support for visualizing SpecForge results in Jupyter notebooks
- LLM Features: AI-powered spec generation and diagnostic explanations
Configuration
The extension requires the SpecForge server to be running. Configure the server connection in VSCode settings.
Server Connection
-
API Base URL (
specforge.apiBaseUrl): The base URL for the backend analysis server. This is ignored ifspawnServeris enabled. (string, default:http://localhost:8080) -
Spawn Server (
specforge.spawnServer): If enabled, the extension manages the SpecForge server process locally instead of connecting to an external server viaapiBaseUrl. (boolean, default:false) -
Server Path (
specforge.serverPath): The command or absolute path to the SpecForge binary. RequiresspawnServerto be enabled. (string, default:specforge) -
Preferred Port (
specforge.preferredPort): The preferred port for the locally spawned SpecForge server. The extension will attempt to use this port, but will fall back to another available port if it is already in use. RequiresspawnServerto be enabled. (integer between 1 and 65535, default:8080)
Server Tuning
These settings only apply when spawnServer is enabled.
-
Cache Bound (
specforge.cacheBound): The size of the LRU cache for SMT solver results. Leave blank for default. (integer or null, default:null) -
Semaphore Limit (
specforge.semaphoreLimit): The maximum number of concurrent SMT solver processes. Leave blank for default. (integer or null, default:null)
LLM Integration
These settings configure the AI features used for spec generation and diagnostic explanations. The provider and model settings only apply when spawnServer is enabled.
-
LLM Provider (
specforge.llmProvider): The LLM provider used for explanations and spec generations. Options:openai,anthropic,ollama,gemini,default. (string, default:default) -
LLM Model (
specforge.llmModel): The LLM model used for explanations and spec generations. Leave blank for default. (string, default:"") -
OpenAI API Key (
specforge.openAIApiKey): The API key for OpenAI. Leave blank to inherit from the environment, or if irrelevant. (string, default:"") -
Anthropic API Key (
specforge.anthropicApiKey): The API key for Anthropic. Leave blank to inherit from the environment, or if irrelevant. (string, default:"") -
Gemini API Key (
specforge.geminiApiKey): The API key for Gemini. Leave blank to inherit from the environment, or if irrelevant. (string, default:"") -
Ollama API Base (
specforge.ollamaApiBase): The API base URL for Ollama. Leave blank to inherit from the environment, or if irrelevant. (string, default:"")
Other Settings
-
Enable Preview Features (
specforge.enablePreviewFeatures): Enable experimental features that are not yet ready for release. (boolean, default:false) -
Trace Server (
specforge.trace.server): Traces the communication between VS Code and the language server. Useful for debugging extension issues. Options:off,messages,verbose. (string, default:off)
Initializing a New Project
You can initialize a directory with the recommended project structure from VSCode. Open the command palette (Ctrl+Shift+P / Cmd+Shift+P) and run SpecForge: Initialize SpecForge Project. This is equivalent to running the init CLI command.
This command will only work if specforge.spawnServer is enabled and specforge.serverPath is correctly configured, since it relies on the SpecForge binary.
We recommend that when working on a SpecForge project in VSCode, you open the project root directory as the sole workspace folder.
Language Features
Parsing and Type Checking
The extension performs real-time checking as you write specifications. Errors will be underlined. Hovering over the affected code will show the error:
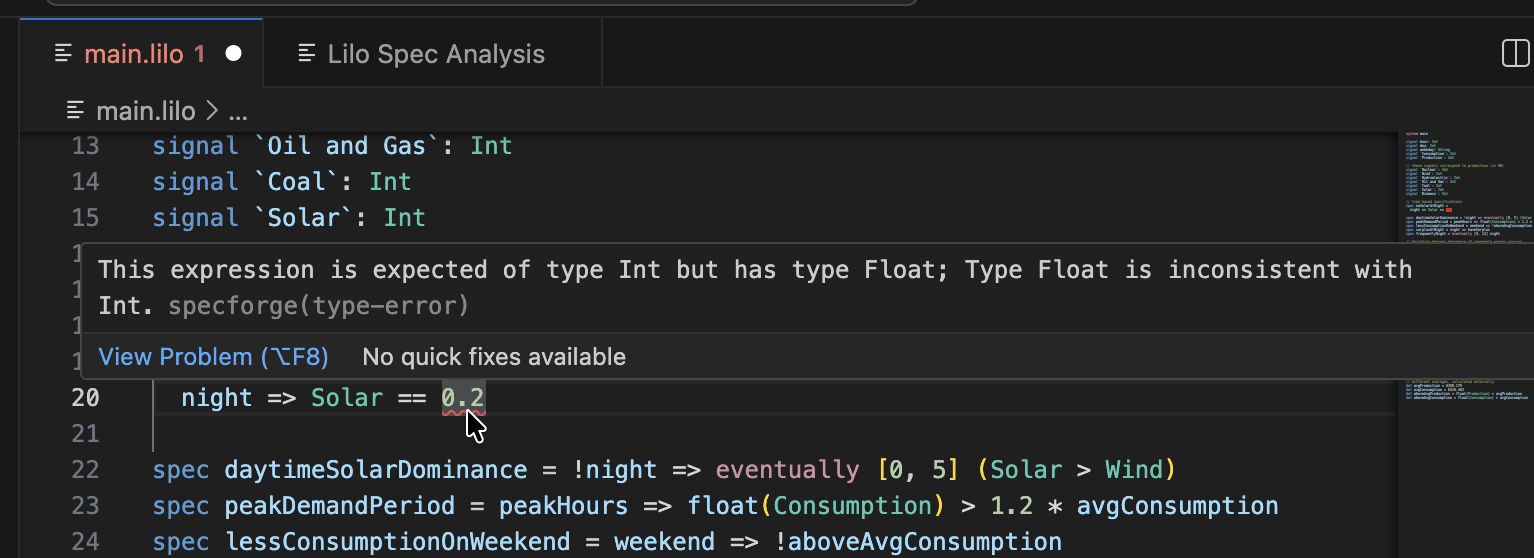
The extension will check for syntax errors, type errors, etc.
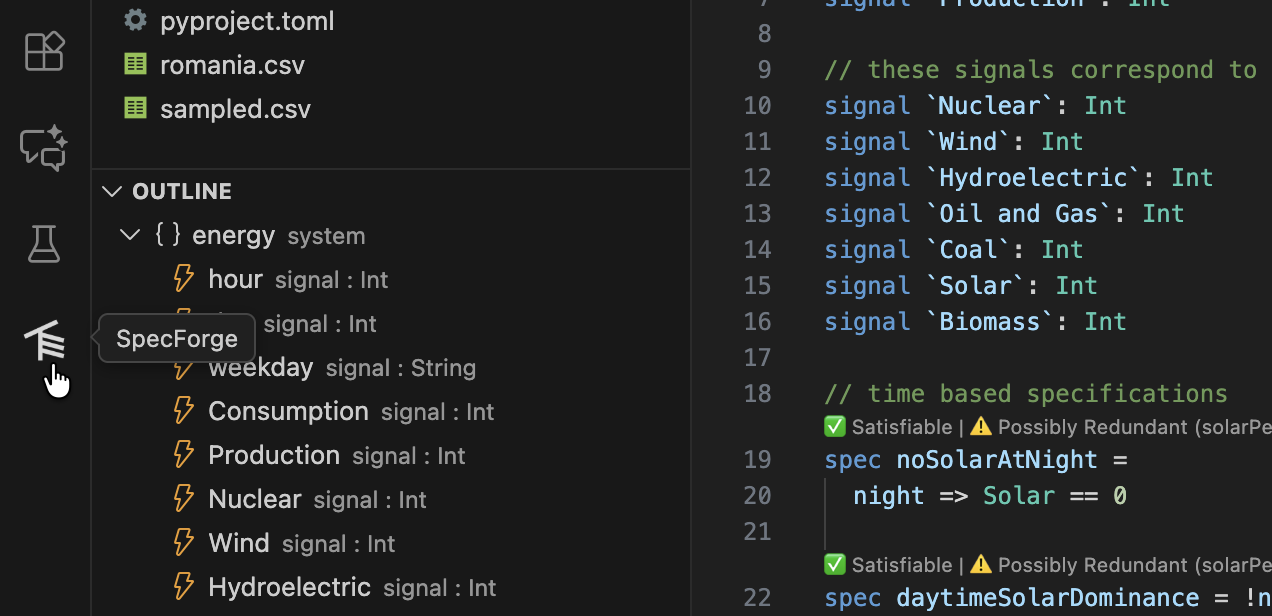
Document Outline
The extension provides a hierarchical outline of your specification file:
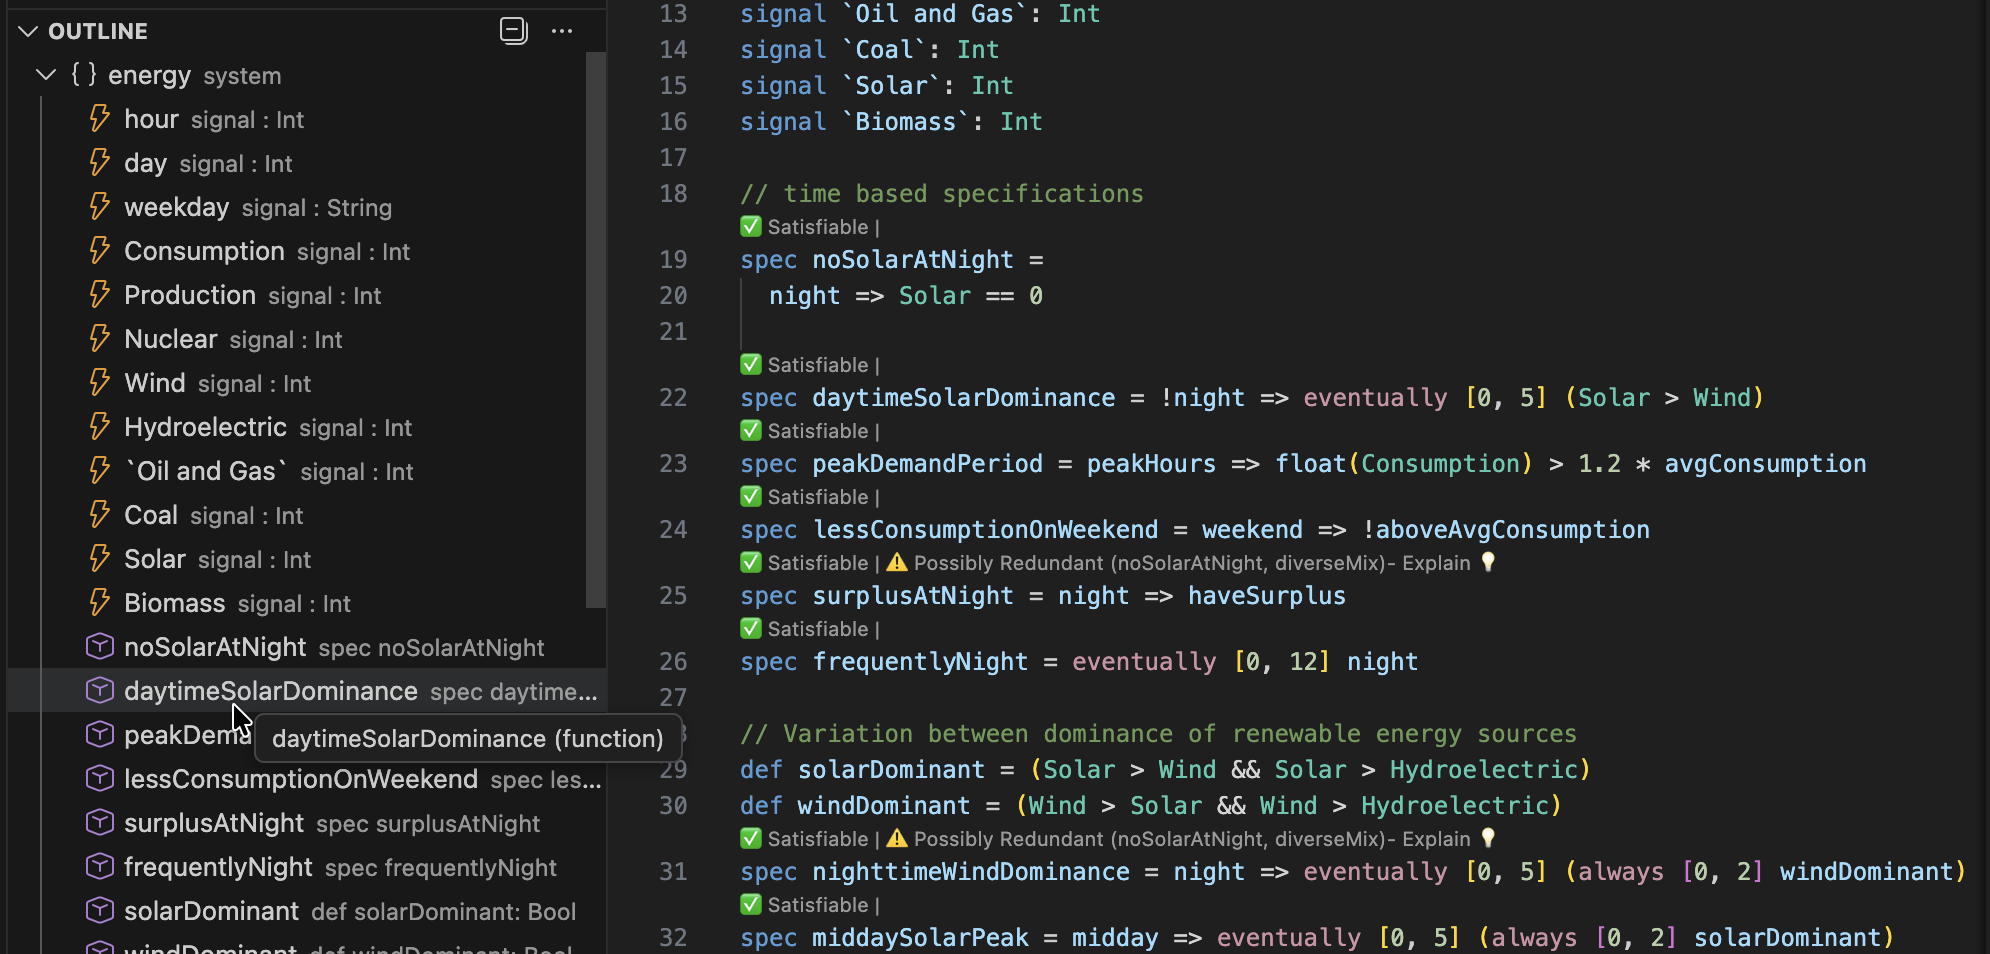
- Open the “Outline” view in VSCode’s Explorer sidebar
- See all specs, definitions, signals, and parameters at a glance
- Click any symbol to jump to its definition
- The outline updates automatically
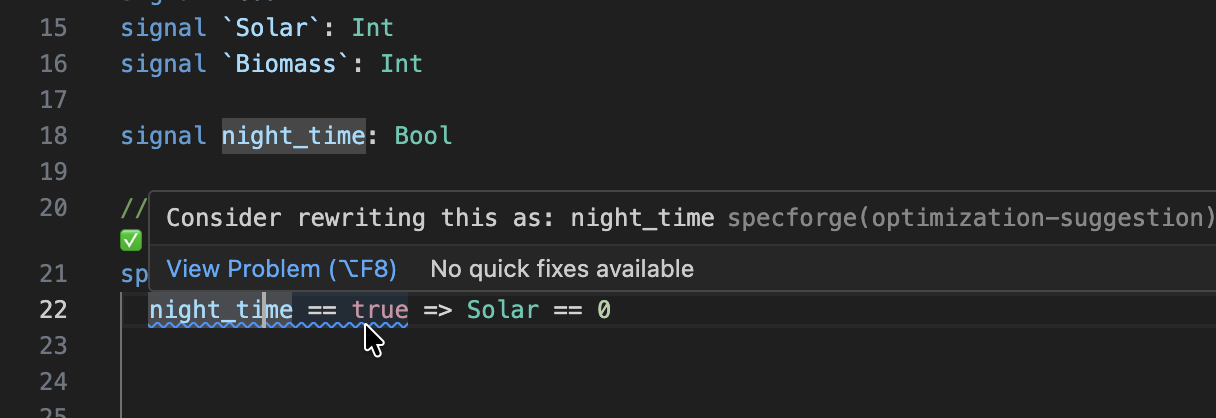
Diagnostics
The extension performs various checks automatically and provides feedback.
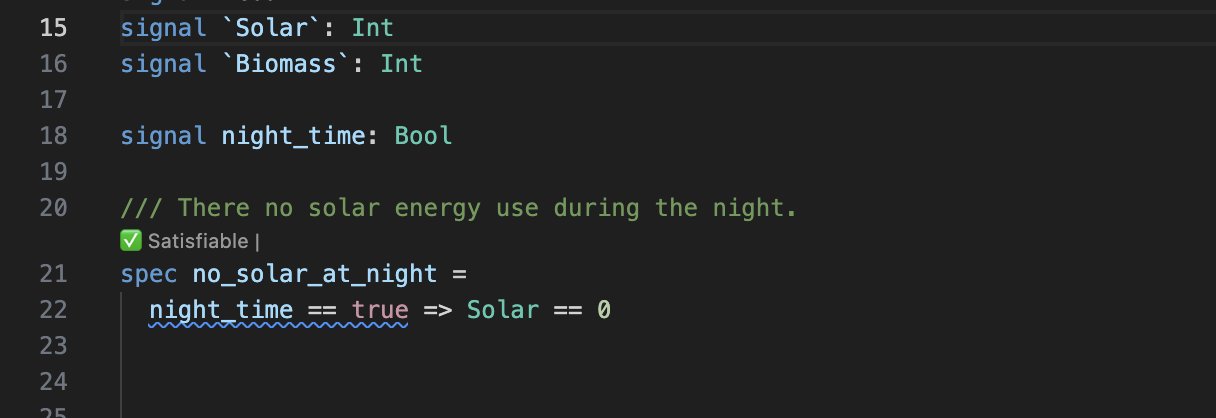
Hovering over a diagnostic will reveal the message.
Diagnostics include:
- Warnings for unused
signals,params,defs, etc. - Optimization suggestions.
- Warnings about using time-dependent expression in intervals (if so configured).
Code Lenses
Code lenses are interactive buttons that appear above specifications in your code, offering information and possibly actions.
Satisfiability Checking
Above each specification, you’ll see a code lens indicating whether the spec is satisfiable:
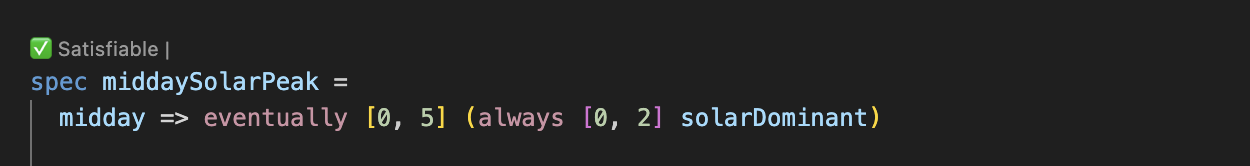
When a spec is satisfiable, the “✅ Satisfiable” lens is clickable. Clicking it opens the Spec Analysis pane with the Exemplify analysis pre-selected for that spec, so you can immediately generate an example trace that witnesses the spec’s satisfiability.
Here is a spec that SpecForge has detected might be unsatisfiable:
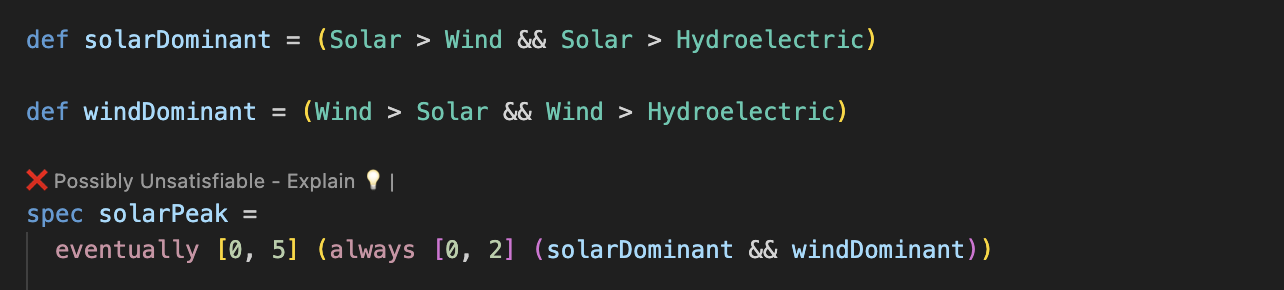
The user can ask for an explanation:
If SpecForge could not decide the satisfiability, it is possible to relaunch the analysis with a longer timeout.
Redundancy
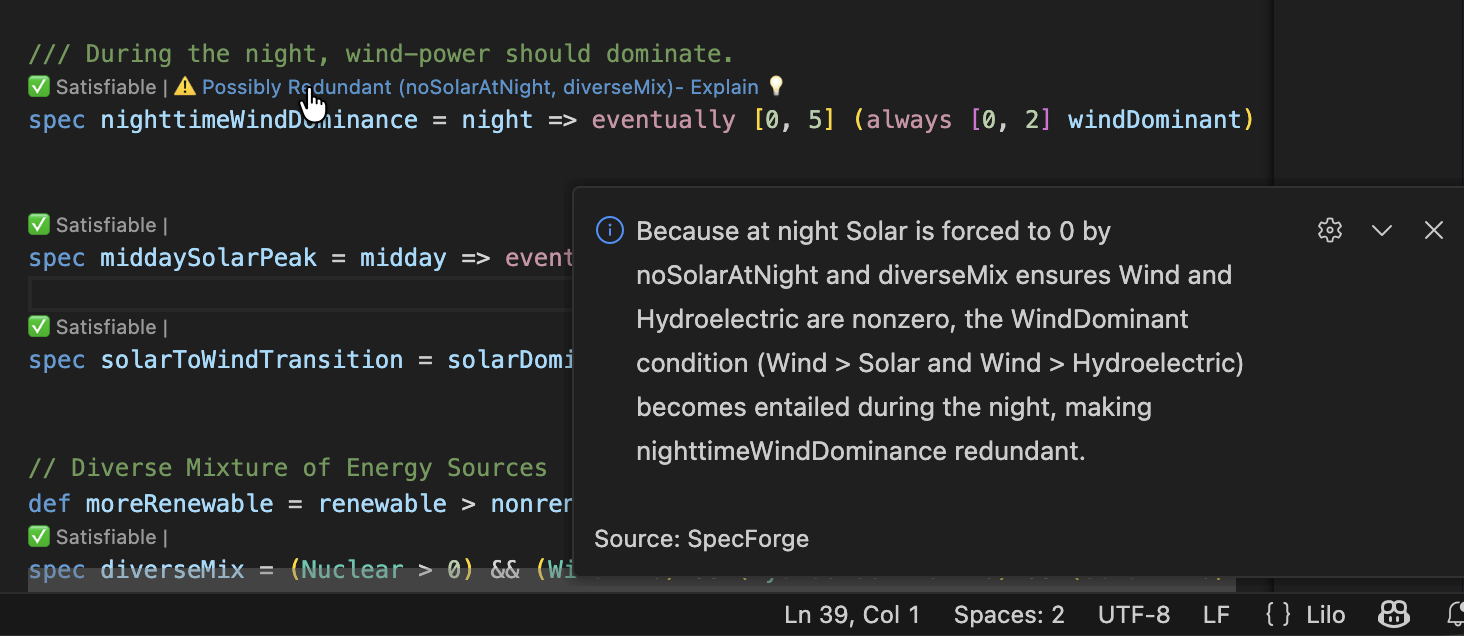
If the system detects that a spec might be redundant, a warning is show as a code lens:
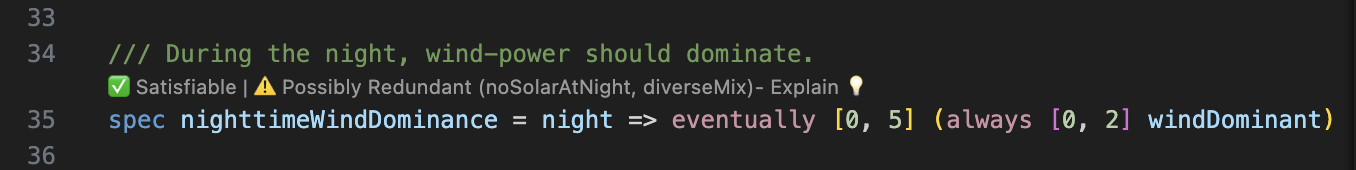
In this case, SpecForge is indicating that the spec is implied by the specifications noSolarAtNight and diverseMix, and is therefore not necessary. By clicking Explain, an explanation for the redundancy is produced:
Stubs
If a spec or an assumptiondoes not have a body, it is called a stub. In this case a code lens offers to generate the specification using AI.
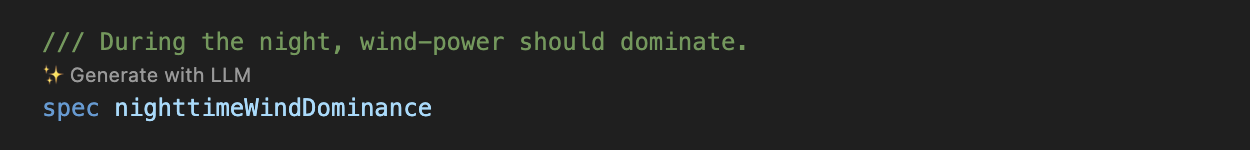
Clicking Generate with LLM will produce a definition for the specification, that works with the current system. If the spec is too ambiguous, or if there is some other obstacle to generation, an error message will be shown.
Spec Status Pane
To access the spec status panel, click the SpecForge icon on the left hand side of VSCode:
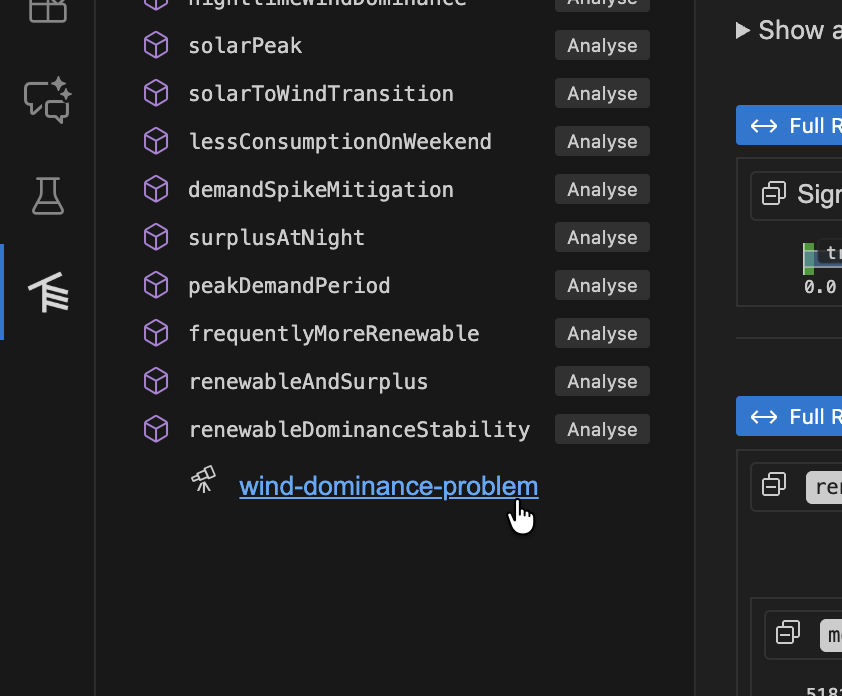
The sidebar lists all the specification files and the specs that are defined:
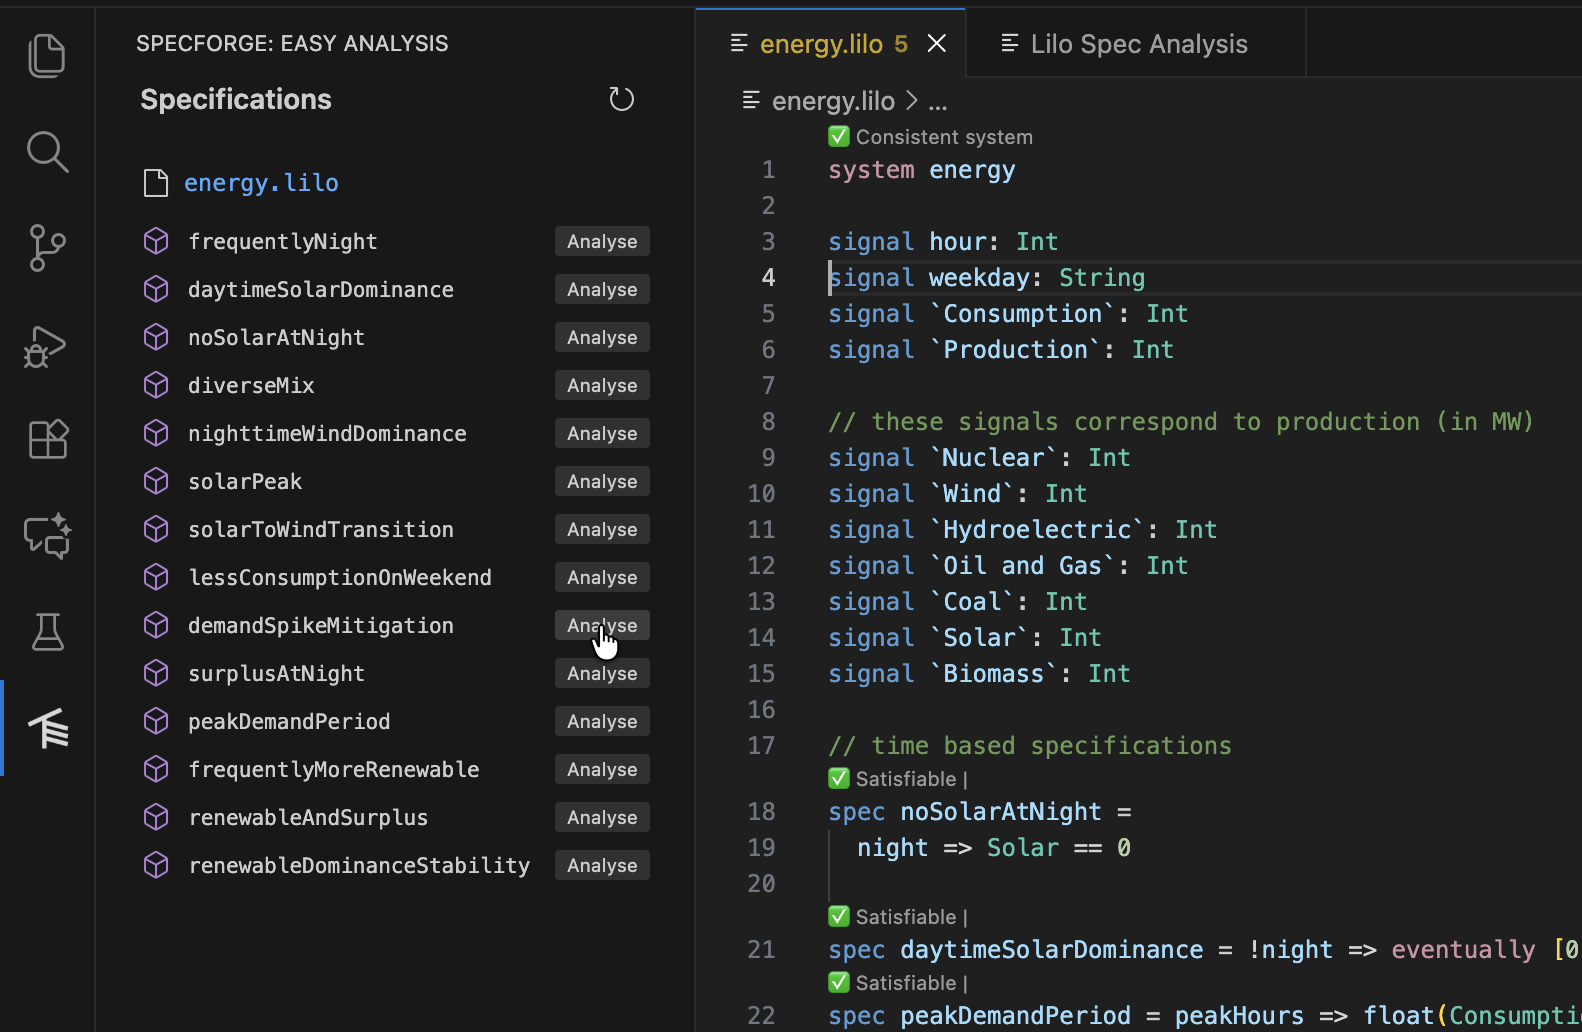
Clicking Analyze next to a spec will bring you to a spec analysis window. You can use this to launch various spec analysis tasks: monitoring, exemplification, export, animation and falsification.
Filtering and Query Syntax
The filter box in the Spec Status Pane can be used to narrow the visible specifications.
Unquoted text is treated as a fuzzy text search, while quoted text must produce an exact match. Both match against:
- the specification name
- docstrings
- aliases
For example, searching for pump or temperature limit will match specs whose names or metadata are close to those terms.
You can also filter by custom field using field:value syntax:
priority:>10 reviewed:true owner:"ops"
Custom-field predicates only apply to field names that actually exist in the current workspace. Supported comparison operators are: =, !=, <, <=, >, >=.
Examples:
priority:2priority:>=2reviewed:trueowner:"ops"
Multiple text terms and field predicates are combined with AND, so a specification must satisfy all of them to remain visible.
Label chips can also be toggled in the sidebar. Label selections are combined with OR across the selected labels, and then combined with the text query as an additional filter.
For example, to monitor a specification, select Monitor from the dropdown, and choose a data file to monitor, and click Run Analysis.
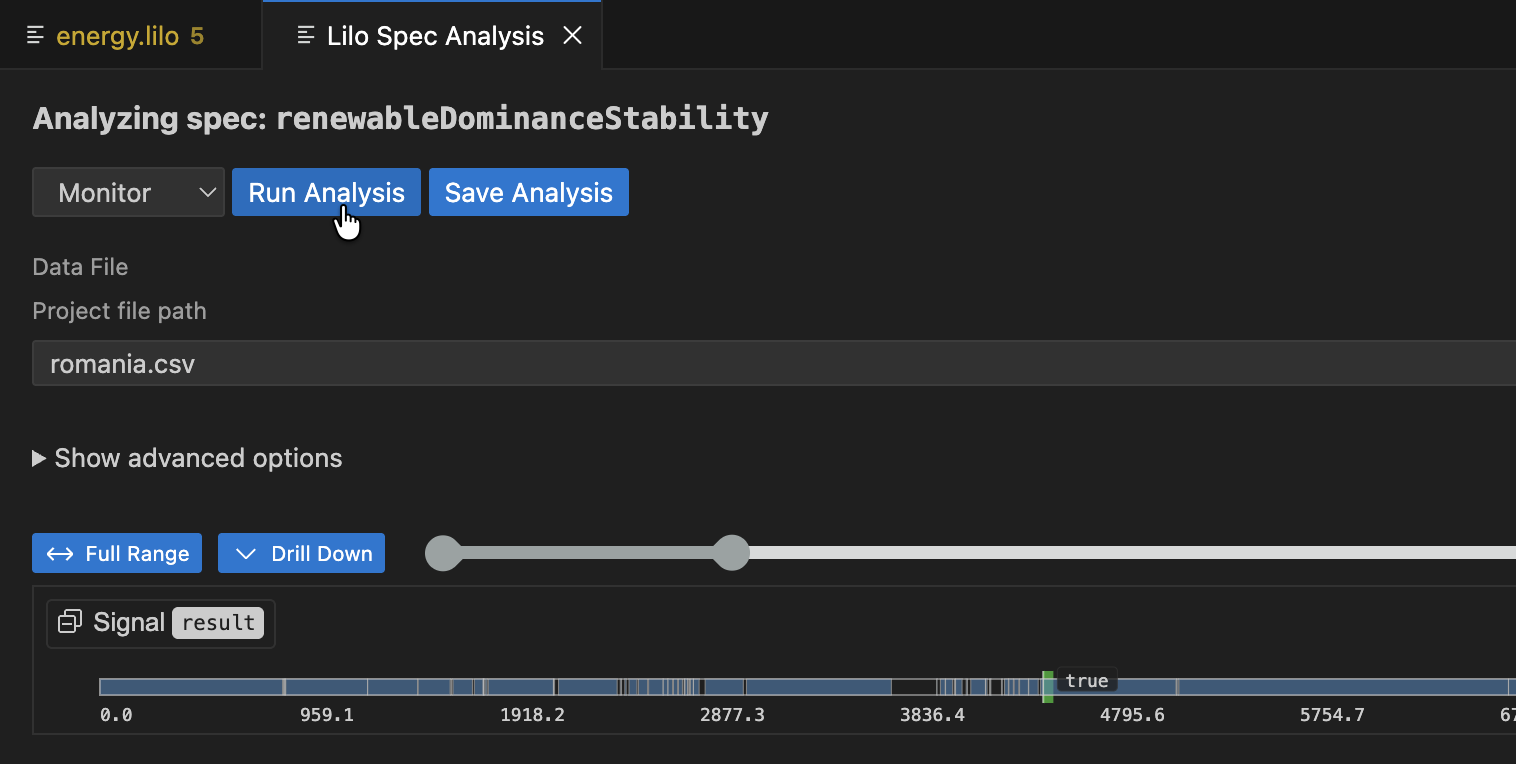
The result of the analysis is shown. The blue areas represent the times where the specification is true. For large data files, only the boolean result is shown. To better understand why a specification is false at some point, select a point and click Drill Down.
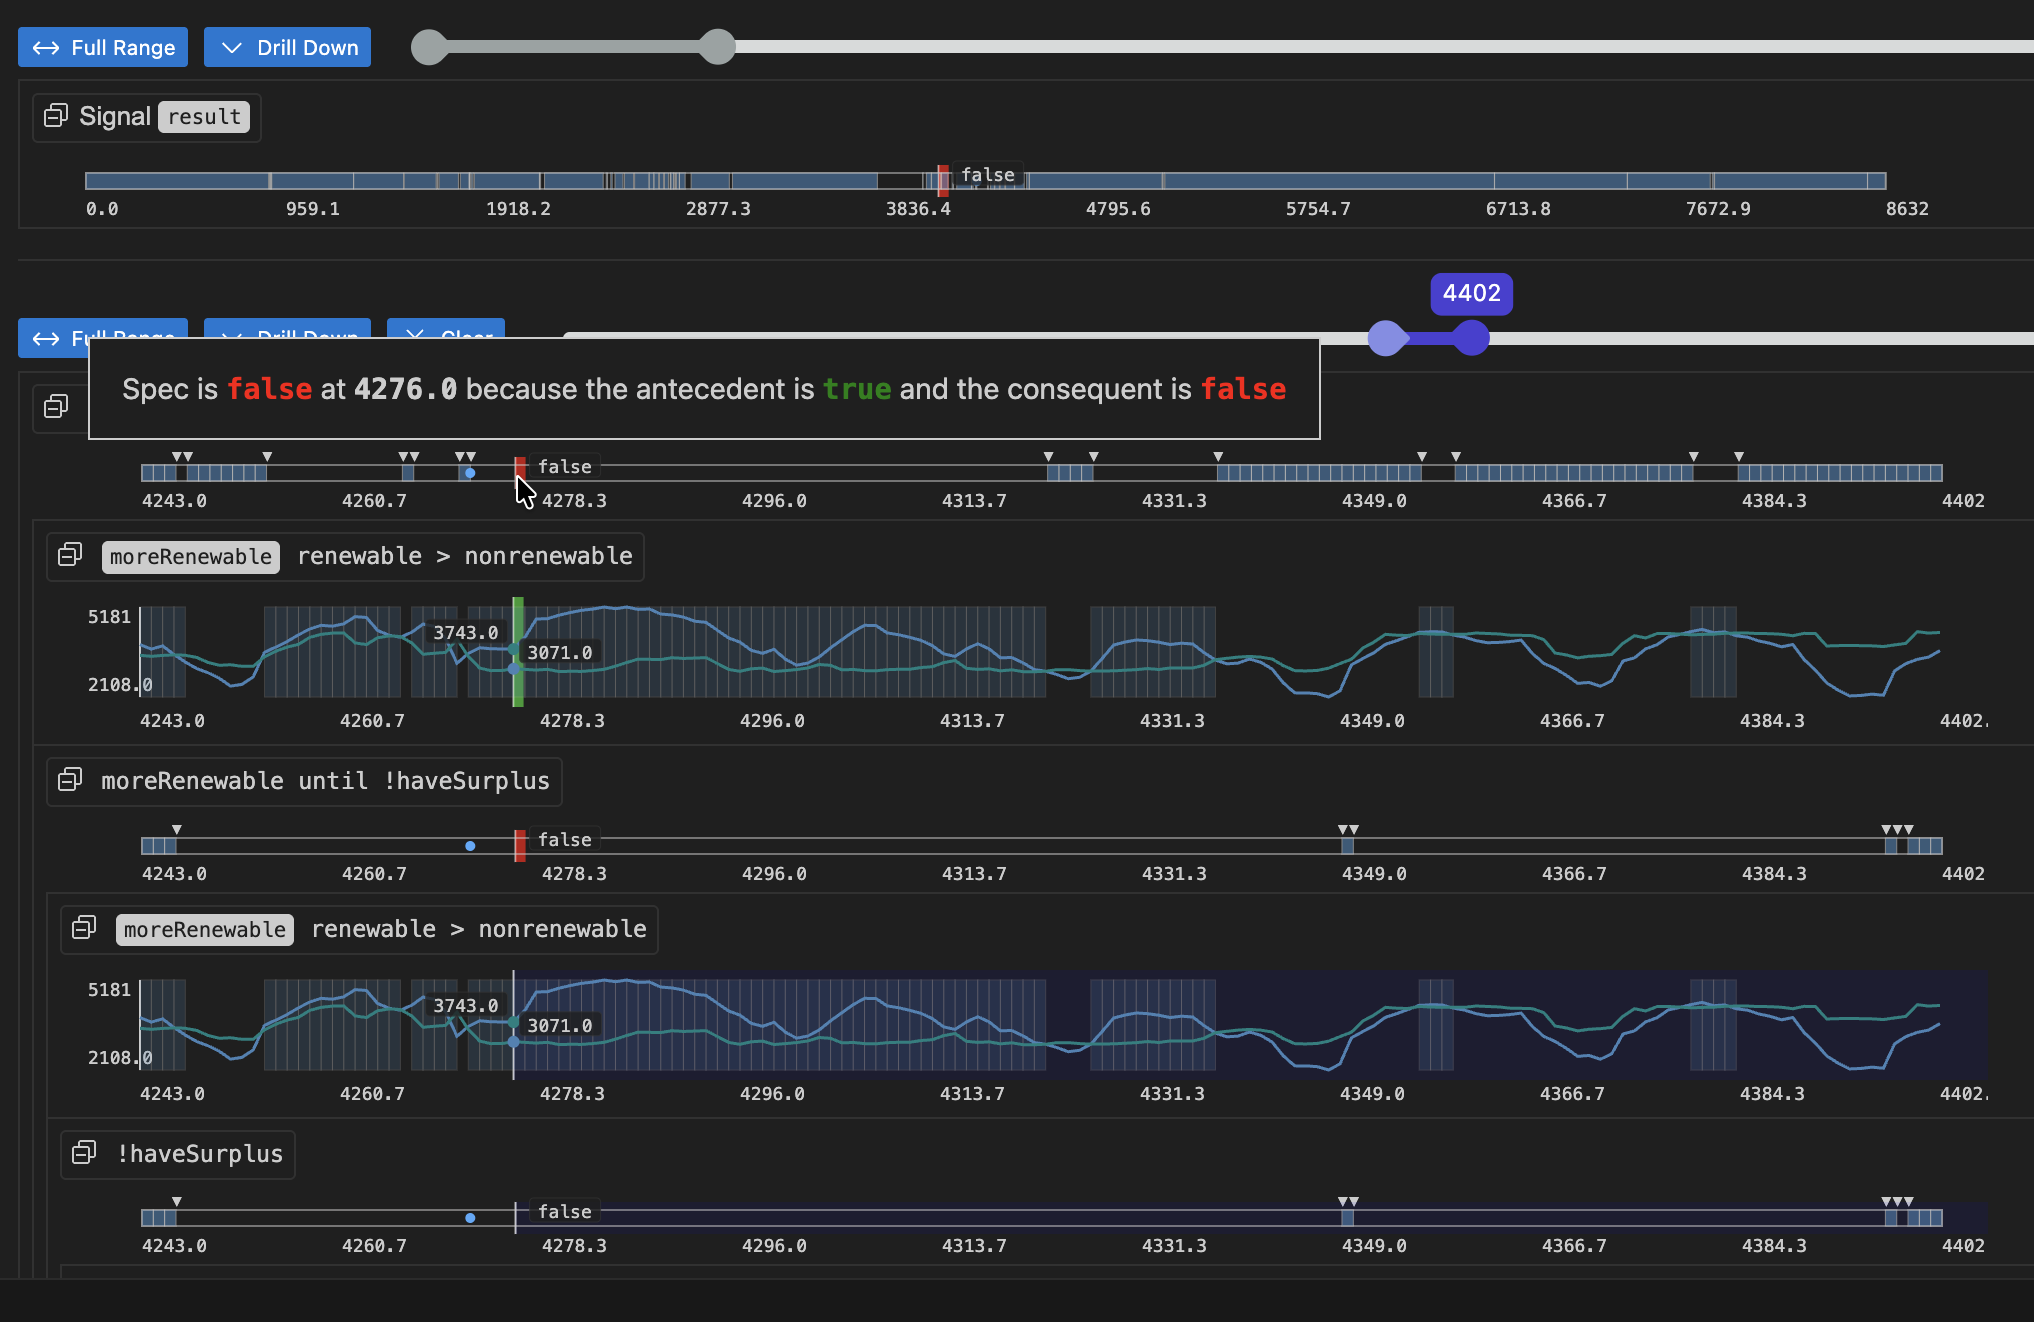
The drill-down has chosen a small enough segment of the full data source in order to present the debugging tree. This will show a tree of monitoring result for the whole specification. Each node can be collapsed or expanded. Hovering on the timeline will also highlight relevant regions in sub-expression result timelines. Hovering on a timeline will display an explanation of why the result is true or false at that point in time, for that sub-expression.
A spec analysis such as this can be saved by clicking on the Save Analysis button.
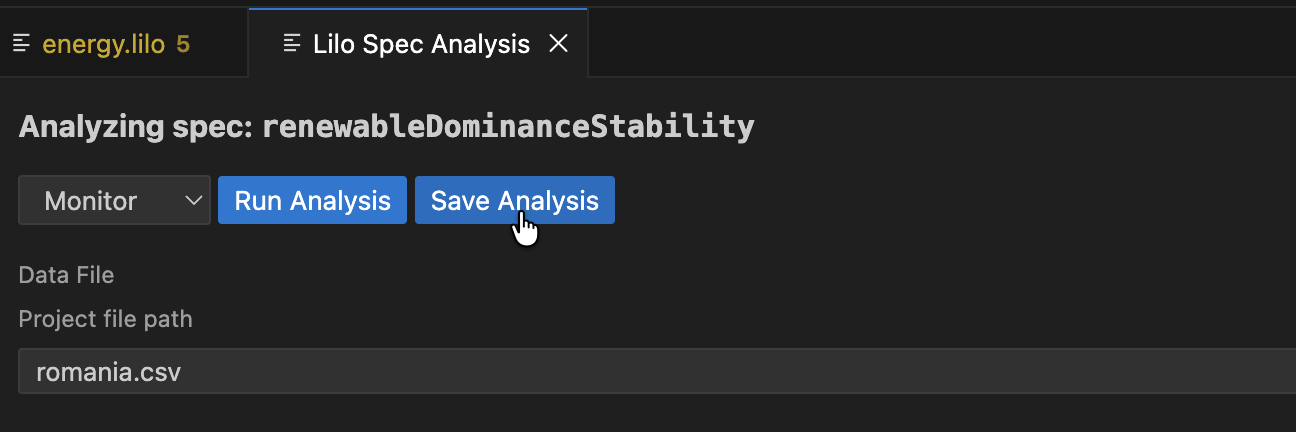
Choose a location in your project to save the analysis.
Saved analyses will show up in the spec status side panel, underneath the relevant spec.
Analysis Types
The GUI supports five types of analysis:
1. Monitor
Check whether recorded system behavior satisfies your specification.
Inputs:
- Signal Data: CSV, JSON, or JSONL file containing time-series data
- CSV: Column headers must match signal names
- JSON/JSONL: Objects with keys matching signal names
- Parameters: JSON object with parameter values
- Options: Monitoring configuration (see Monitoring Options)
Output:
- Monitoring tree showing spec satisfaction over time
- Drill-down into sub-expressions
- Visualization of signal values
Example:
{
  "min_temperature": 10.0,
  "max_temperature": 30.0
}
2. Exemplify
Generate example traces that satisfy your specification.
Inputs:
- Number of Points: How many time time points to generate (default: 10)
- Timeout: Maximum time to spend generating (default: 5 seconds)
- Also Monitor: Whether to also show monitoring tree for the generated trace
- Assumptions: Additional constraints for the solver to satisfy, each with a rigidity level (Hard or Soft). See Exemplification and Satisfiability for details on assumptions and rigidity levels.
Output:
- Generated signal data as time-series
- Optional monitoring tree if “Also Monitor” is enabled
- CSV/JSON export of generated data
Use Cases:
- Understanding what valid behavior looks like
- Testing other components with realistic data
- Creating test fixtures
- Validating your specification makes sense
3. Falsify
Search for counterexamples that violate your specification using an external model.
Prerequisites:
- A falsification script must be registered in
lilo.toml:
[[system_falsifier]]
name = "Temperature Model"
system = "temperature_control"
script = "falsifiers/temperature.py"
Falsification Script Protocol:
Your script receives these command-line arguments:
--system: The system name--spec: The specification name--options: JSON string with options--params: JSON string with parameter values--project-dir: Path to the project root
The script should:
- Simulate the system according to the specification
- Search for a trace that violates the spec
- Output JSON in the correct format with either success or failure.
Inputs:
- Falsifier: Select from configured falsifiers (dropdown)
- Timeout: Maximum time for falsification (default: 240 seconds)
- Parameters: JSON object with parameter values
Output:
- If counterexample found:
- Falsification result showing the failing trace
- Automatic monitoring of the counterexample
- Visualization of where/how the spec fails
- If no counterexample found: Success message
Make sure your script is executable:
chmod +x falsifiers/temperature.py
4. Export
Convert your specification to other formats.
Export Formats:
- Lilo: Export as
.liloformat with optional transformations - JSON: Machine-readable JSON representation
Inputs:
- Export Type: Select the target format
- Parameters: Parameter values (if needed for export)
Output:
- Exported specification in the selected format
- Can be saved to a file
Use Cases:
- Integrating with other tools
- Documentation generation
- Archiving specifications
5. Animate
Create animations showing specification behavior over time.
Inputs:
- SVG Template: Path to SVG file with placeholders
- Signal Data: CSV, JSON, or JSONL file with time-series data
- System Parameters (optional): Parameter values for the system, provided as a JSON file or inline values. These supply values for
paramdeclarations in the Lilo system definition.
Output:
- Frame-by-frame SVG images showing system evolution
- Can be combined into an animated visualization
SVG Template Format:
Your SVG template should include data-attributes for signal values, e.g.:
<svg
  xmlns="http://www.w3.org/2000/svg"
  width="100"
  height="100"
  viewBox="0 0 40 40"
  role="img"
  aria-label="Transformed ball"
>
  <rect width="100%" height="100%" fill="white" />
  <g transform="translate(0,50) scale(1,-1)">
    <circle cx="20" data-cy="temperature" cy="0" r="3" fill="black" stroke="white" />
  </g>
</svg>
In this example, the <cicle> elements cy attribute will be animated by the value of the temperature signal, thanks to the data-cy="temperature" attribute.
Monitoring Options
When running Monitor or Falsify analyses, you can configure these options:
- Time Bounds: Restrict monitoring to a specific time range
- Sampling: Adjust temporal resolution
- Signal Filtering: Monitor only specific signals
- (Additional options may be available)
Working with Results
Monitoring Tree
The monitoring tree shows:
- Root: Overall spec result (true/false/unknown)
- Sub-expressions: Drill down into why the spec is true or false
- Timeline: Hover over any expression to see when it’s true/false
- Highlighting: Relevant segments are highlighted when hovering
Loading Saved Analyses
Open a saved .analysis.sf file to:
- See the original configuration
- Re-run the analysis with the same settings
- Modify parameters and run again
- Export results
The Analysis Editor provides the same interface as the main analysis GUI, but pre-populated with your saved configuration.
An analysis is a file, if you modify the analysis, you should save it.
Jupyter Notebook Integration
The extension includes a notebook renderer for displaying SpecForge results in Jupyter notebooks.
Activation
The renderer automatically activates for:
- Jupyter notebooks (
.ipynbfiles) - VSCode Interactive Python windows
Usage with Python SDK
When using the SpecForge Python SDK, results are automatically rendered:
from specforge import SpecForge

sf = SpecForge()
result = sf.monitor(
    spec_file="temperature_control.lilo",
    definition="always_in_bounds",
    data="sensor_logs.csv",
    params={"min_temperature": 10.0, "max_temperature": 30.0}
)

# result is automatically rendered in the notebook
result
Snippets
The extension provides Python code snippets for common SpecForge operations (monitor, exemplify, export). Type the snippet name and press Tab to insert and navigate through placeholders.
Troubleshooting
Extension Not Working
Check the SpecForge server:
- Ensure the server is running (see Setting up SpecForge)
- Verify the API base URL in settings matches your server
- Check the server logs for errors
Restart the language server:
- Run
SpecForge: Restart Language Serverfrom the command palette - Check the “Output” panel (View → Output) and select “SpecForge” from the dropdown
Diagnostics Not Appearing
Trigger a refresh:
- Save the file (Ctrl+S / Cmd+S)
- Close and reopen the file
- Restart the language server
Check server connection:
- Look at the status bar for connection status
- Verify the server is reachable at the configured URL
Code Lenses Not Showing
Check configuration:
- Ensure code lenses are enabled in VSCode:
Editor > Code Lens - Save the file to trigger code lens computation
Check for errors:
- Look for parse or type errors that prevent analysis
- Fix any red squiggles in your code
Analysis GUI Not Loading
Check webview:
- Open the Developer Tools:
Help > Toggle Developer Tools - Look for errors in the Console tab
- Check if the webview iframe loaded
Check server connection:
- Verify the API base URL is correct
- Test the URL in a browser (should show a JSON response)
Falsification Script Errors
Verify script setup:
- Check the script path in
lilo.toml - Ensure the script is executable:
chmod +x script.py - Test the script manually with example arguments
Check script output:
- The script must output valid JSON
- Use the correct result format (see Falsify)
- Check script logs for error messages
Common issues:
ENOENT: Script file not found (check path)EACCES: Script not executable (runchmod +x)- Parse error: Invalid JSON output (check script output format)